torsdag 21 februari 2019

OzCode + 3D Map (Excel) - a perfect match

I work with various GIS development. Anyone worked with GIS knows that you need to visualize data to understand what's going on. Several times I have searched for time to write a plugin to visualize geo data (coordinates) directly in Visual Studio, without going through a painful process exporting it via WKT (Well Known Text) and then import to Quantum GIS or any other suitable client.

Today it almost happened! At work we use OzCode, a truly awesome debug plugin for Visual Studio. One cool feature is exporting collections to Excel. I have used that feature from time to time in my daily work. Today, OzCode + Excel with 3D Maps made perfect match!

This is how it works.

Step 1. Export from Visual Studio


Step 2. Mark columns in Excel and insert 3d map.
Done!

tisdag 7 augusti 2018

California on fire

According to Swedish news 115 000 hectars is on fire in California, US, but how big area is that?
Play with the map to find out how much the fire cover your home town!


As always with calculating there will be deviations. Deviation: 

tisdag 31 juli 2018

Volotile Azure Maps TypeScript definitions

I wanted it, I couldn't find it so I created it!


It is published on GitHub here under MIT-license. 

Next step will be to publish it on Nuget, NPM and of course definitely typed. But I would like to play with it a bit first.

Hopefully it will be usefull.

söndag 29 juli 2018

Aiding the user with Azure Maps search and type ahead

Azure Maps offers geocoding as part of search. In my experience one thing I rarely see is UI helping the user entering correct addresses. Here is an example from editing contact profile in Azure portal as  per 28/7-2018.

Helping the user entering addresses not just increases quality and user experience it will also give the opportunity to store the actual location for further usage depending on context.

So what does it takes to use Azure Maps in this scenario. Well, not much. depending on how you count rows it is about 40 lines of code for a form. About 8 lines is actually dealing with the Azure Maps geocoding service - the rest is things around.

!NIH
This post is about using a service aiding users entering addresses. Therefore the code is using Awesomplete as type ahead component. In most real world integrations there is probably allready a UI framework in place.


Components through Nuget?
Hopefully there will be several components available. Maybe it already is? Via Nuget? XAML, Bootstrap, Office365?


I know Azure IoT-Hub using this kind of components. A good start.

One parameter to keep in mind is the typeahead parameter in the request URL. The documentation states: "If the typeahead flag is set, the query will be interpreted as a partial input and the search will enter predictive mode".


The code is on here on GitHub.

torsdag 21 juni 2018

Azure Maps and Turf - a perfect match

Azure Maps is a new mapping platform from Microsoft, the geometries and features following GeoJSON format and expect coordinates in WGS84. Turf is an open source library for geometry analasis and manipulation. Turf expect GeoJSON.

So I took a few minutes to play with the combination of Bing Maps and Turf and I found it as a perfect match. With just six lines of code I:

  • created a random linestring with turf (perfect for testing)
  • buffered the linestring. 
  • calculated the map extent
  • added some styling
  • added the buffer
  • focus the map to the extent and added some padding.
In fact it is a one to one line translation of the algorithm above to code! Namespace in Azure Maps is still Atlas, I don't know if that is expected to change because I believe Atlas was the project name for Azure Maps.


const lineString = turf.randomLineString(1, {bbox: [15, 61, 18, 63],
   num_vertices: 10, max_length: 0.5});

let lineBuffer = turf.buffer(lineString, 0.8);

const bbox = turf.bbox(lineBuffer);

lineBuffer.features[0].properties = {color: "rgba(0, 255, 255, 0.7)",
   outlineColor: "blue"};

map.addPolygons([lineBuffer.features[0]]);

map.setCameraBounds({bounds: bbox, padding: 100});


That's it! This could have been an difficult operation. It is not - thanks to standard formats, people and organisations adapting it.

One thing I like with Turf and Bing Maps is the ability to generate test data. In Turf it's a bit hidden in the Random section, for example randomLineString.

The industry is starting to gather around GeoJSON. At least leading players such as Micrsoft and MapBox who is also backing Turf.

When will there be a binary standard format with the same adaption as GeoJSON ? Maybe GeoBuf?


måndag 23 april 2018

Snakeline module - bringing life to the map

Animations are great in many situations. For example helping the user solving a task, today animations is a natural part in applications. So therefor I thought it was time to have a Polyline animation module - or a snakemodule. There is a good article about animations in Bing Maps here https://blogs.bing.com/maps/2014/09/25/part-2-bring-your-maps-to-life-creating-animations-with-bing-maps-net/. The principles should be about the same but the v7 control is outdated.


Except adding life to the application animating a polyline makes sense in some use cases. For example when in comes to routing and directions. Animate the route from A->B also emphasize the direction for the user.

Moreover I added possibility to have several poly line styles for one polyline, I don't know if I missed anything from the documentation but I added ability to add mulitple styles. But wouldn't it be cool to declare style the same way CSS is declared? Being able to adding a shadow to geometry is a nice way enhancing the information. 

The module

The snakemodule is structured in two, three pieces. The first piece densifies if needed the polyline, as shown in the image below. The spatial math library is a big help for this task. The second part plots the chunks with a "frame duration" of 15 ms. The animation duration is configurable when calling the draw function.


The code is published on Github, feel free to try it. But I would have loved to see a repository with various modules, libraries etc on GitHub coordinated by Microsoft. 

tisdag 10 april 2018

How long is my route?

How long is my route actually? When it comes to routing there is one thing that is for sure - there are no rights and wrongs. Routing is indeed an interesting subject.

What length of the route does Bings Direction service provide? I suspect the length is in 2d, not the actual driving distance. So lets find out.

Calculating 3d distance on a sphere is hard. So first I need to narrow it down to something that is understandable for me. So I route between my home town and a ski resort in the mountains.

First lets inspect what Bing Maps returns in route summary. Is says the route is 283.758 km. Using the method Microsoft.Maps.SpatialMath.getLengthOfPath(path) and passing path gives 283.981 which is about 220 meters different. It is a different that is such small that is just academia. It is impressing that the client returns such accurate result considering it is JavaScript.

So lets examine what happens when transforming the coordinates to UTM. Fortunately the route is within the same UTM zone. So for each segment I simple used Pythagoras formula to calculate the length of each segment. It gives me 284.491 km. It gives a difference of 0.25%. Still within what is acceptable for this experiment.

In order to measure in 3d I use the elevations service for each location received from the direction service. After that all I need to do is add the elevation to the location.

Since it is now a planar coordinate system it is now possible to calculate 3d length with Pythagoras formula, according to this: https://math.stackexchange.com/questions/42640/calculate-distance-in-3d-space. The result surprised me though. Given planar conditions it says 284.538. Which is a different of 47 meters.That is a big surprise! I thought it would be more significant.

And comparing my 3d route length with the length from spatial math library it just about 0.01%.

My conclusion is that for driving it is not really worth calculating if it is not in extreme terrain. But for walking and bicycling it makes sense to take elevation into account.

The code is here for scrutiny: https://github.com/perfahlen/how-long-is-my-route

måndag 22 januari 2018

Spatial Server Tools?

Over time Microsoft has a history of developing mapping services and applications. It spans from Encarta, with map tours, to lately announced Location based services on Azure. MSFT took the path through various online services such as MapPoint, Virtual Earth and Bing Maps.

I believe over time Microsoft have developed suite tools for handling GIS and spatial information (otherwise they would not deliver the services they have). One thing I found a bit odd is the current Bing Maps client is really powerful with the Spatial Math library in combination with services and the new routing API. But there are not so many tools on the server. Of course there is SQL Server and the library Microsoft.SqlServer.Types. Developing server side GIS with .Net you will probably end up with ESRI or NetTopology Suite (NTS), a powerful open source library).

But I believe there is room and a need for yet another library. For example:
  • Test geometry generator, create test geometries
  • IO, various formats.
  • Spatial Math
  • Geometry compression
Above are all low hanging fruit. In fact all of them are in Bing Maps client.

What if just the functions in Bing Maps client would also be available server side? That would include all four points above. Or what if just the Spatial Math library would be available as a NPM package? Or even a Nuget package and expand from that? 

torsdag 18 januari 2018

Drawing a donut in Bing Maps


Background

Polygons with holes aka donuts have been a challange in web mapping. For not too long ago when customers asked if it is possible to have holes in polygons, I was avoiding the question. It is possible to send an array of rings to the polygon constructor. But within Spatial math library it is possible to achieve holes in polygons pretty easy. If a user draw a polygon on top of a polygon on the same layer, it might mean a hole.

Steps

  1. Create a polygon. The easiest way I know for this use case is to make a circle. 
  2. Create another smaller polygon, a polygon that I use to punch out the hole on the bigger polygon.
  3. Use the difference function in Spatial Math library to punch out the polygon.
  4. Add the donut polygon to the map. Done. 

Implementation

Assuming there is an instantiated Bing Maps variable named map...
 Microsoft.Maps.loadModule('Microsoft.Maps.SpatialMath', () =>; {
    const outer = Microsoft.Maps.SpatialMath.getRegularPolygon(map.getCenter(),
                  30, 36, Microsoft.Maps.SpatialMath.DistanceUnits.Kilometers);

    const outerRing = new Microsoft.Maps.Polygon(outer);


    const  inner = Microsoft.Maps.SpatialMath.getRegularPolygon(map.getCenter(), 
                   10, 36, Microsoft.Maps.SpatialMath.DistanceUnits.Kilometers);

    const innerRing = new Microsoft.Maps.Polygon(inner);
        
    const donut = Microsoft.Maps.SpatialMath.Geometry.difference(outerRing, 
                  innerRing);

    map.entities.push(donut);

    });
It is surprisingly easy to accomplish holes in polygons - and drawing circles. It is about ten lines of code depending on how you count it. Inside the module, it is in fact six lines that acctually do something.

It is powerful, easy to use and it solves reall world problems, like drawing islands on a lake. Or lakes on islands. 

fredag 20 oktober 2017

What does geometry.toString() mean?

toString()

In web development with JavaScript or similar, what is the meaning of geometry.toString()? I was developing a small application and started to think may be it is time to do something more interesting than [object] or Uncaught Not implemented. What if toString() would return the actual string representation of the object? That would make toString() useful.

Since JSON is the natural representation of the object would it  make sense to simple return a stringified GeoJson? I think so. For polygon the implementation would look something as:

Microsoft.Maps.Polygon.prototype.toString = function () {
    var _json = Microsoft.Maps.GeoJson.write(this);
    return JSON.stringify(_json);
}

Does it make sense? At least it does for me since I can just write geom.toString() when I need to communicate with the server.

Of course there are alternatives to GeoJSON, WKT, well known text for example. I think it would be elegant to just write geometry.toWKT(); Adding it to the module would make sense. While waiting for an update, adding it when the modules callback would look something like:

Microsoft.Maps.loadModule('Microsoft.Maps.WellKnownText', function(){
    Microsoft.Maps.Polygon.prototype.toWKT = function () {
        var wkt = Microsoft.Maps.WellKnownText.write(this);
        return wkt;
    }
}

What if I could add this suggestions to GitHub issues for modules?

Friday afternoon geo dev thoughts.

Small example implementation; https://github.com/perfahlen/toString

fredag 8 september 2017

Cognitive routing

A bit background

The last couple of months I have checked out and tried Microsofts preview advanced routing projects. First when it comes to routing it is important to understand there is no rights or wrong. What is the best route? For some it might be:
  • The shortest route?
  • The fastest route?
Those are easy to find. For others they might be?
  • A route with minimun slope?
  • A route with rest areas with parking facilities?
  • The most beautiful route?
  • ... and so on.
So, the best route can be different depending on the purpose of the trip, vehicle and different regulations. So I always keep that in mind when it comes to routing.

Cognitive?

So is it cognitive as the URL implies? When I am in the middle of development, it is algorithms and algorithms with predicates. Combining this new routing services with advanced client tools is for sure a powerful tool. Adding historic traffic data to predict calculate routes, isochrones and solving TSP is calculating complicated stuff in short period of time. So the rise of cognitive GIS is coming.

It is at least really powerful and can solve complex problem and will be useful for many organisations.

Down the road

In order to understand what is next I look back to be able to connect the dots ahead. Isochrones is a natural derivat of routing. Although I guess the challenge with an algorithm that is heavily heuristic (which I assume Bing Maps are) is to polish away the heuristic but still be effective to accomplish isochrones. Next in this area would be to calculate things that is n minutes/distances away, but not closer than n unites from a given point as I describes in this post. Another natural evolvement is travelling salesman problem. Natural to integrate into the service module in CRM and may be a Geo-Calendar is on its way from Bellevue/Redmond.  

What to expect?

From a technical perspective I guess this new services will be available in a C# API like the Bing Maps REST Toolkit. That feels like a safe bet. On the client side I would except modules for routing, including the new services.

Another thing I would like to see is that Microsoft truly adapts GeoJson as in every time geographical data is send as JSON - I expect GeoJson.

Moreover, I hope the new services will cover at least Europe as well. If it scales in North America, the hard job with scaling is probably already done.

Thanks to Fredrik Jonsson for illustration.


torsdag 31 augusti 2017

Playing with project Abu Dhabi

Abu Dhabi is yet another interesting preview project from Bellevue addressing Travelling Salesmans Problem.

I have calculated and bid on several quotes regarding different scenarios where one of the cornerstone and foundation were based on different routing algorithms, such as Travelling Salesman Problem (TSP). All kinds of businesses such as transporting kids to school, service staffing serving restaurant machines, telecom service staff, elderly care and so on. The characteristic of these projects where expensive, complicated with none or small amount of guarantee that the project would succeed within budget. The organizations that demanded these functions where small- and mid-size organizations. Many of the above projects dropped due to lack of funding. I believe vendors such as Microsoft play an important role providing these kind of organizations state of the art technology to enable them to be more efficient and maybe save a bit of the environment.

From a business perspective, it is easy to find applications within business applications such as Dynamics CRM. Or why not a geo-caching app within a city in combination with gamification. Well, may be geofication - Pokemon Go have been pretty successful.

But for me, in my life may be if the project is extended to cover Europe as well, Abu Dhabi might solve another problem - my weekends. A big part of my weekends is driving family, getting things from here and there and occasionally to football- (soccer) and hockey games. In between I need to eat and sometimes have time to see my friends. Unfortunately for me, at the moment Abu Dhabi is limited to US.

After playing a couple of hours with the API I have a couple of things running. It is pretty straight forward to query the API with HTTP requests. All of these extending routing projects from Microsoft will hopefully be backed up with an API that builds up the actual requst. And also a module to handle the actual result.

More information can be found here: https://labs.cognitive.microsoft.com/en-us/Project-Abu-Dhabi/documentation


måndag 7 augusti 2017

How far can my electric car take me?

Routing- and module pearls in Bing Maps

Bing maps v8 has been released quite some time now. At a first glance, the API offering what to expect. There are a few things that I would like to have seen as part of the core API.  For example, GeoJSON as it is more or less the industry standard transferring GIS data over network.  However, the sweet juicy bits are in modules and are available whenever needed. Be aware it is not JavaScript modules. The modules spans from visualization, parsing, digitizing to analyze. Some modules, such as GeoJSON, might over time be part of the core API. Adding GeoJSON parsing would indeed make sense. For a complete list of modules see https://msdn.microsoft.com/en-us/library/mt712663.aspx.

Microsoft.Maps.SpatialMath is a truly competent module. That module adds complex spatial calculations and analysis. And yet there is more, combining this module with projects like Nanjing opens up for interesting applications.  For example, how far can I get with my electric car? Or, consider truck drivers, at least in Sweden, they are allowed to drive for a limit of time without having a break. Let’s say 2 hours, then they need to have a break for 15 minutes or so, then they can continue. I don’t know the exact limits. The industry definitely has a need to plan the route with stops accordingly to regulations. For example they might need to find a stop along the route between 90-120 minutes.

To resolve the use case above one way could be:

  1. Calculate the route from A to B.
  2. Calculate Isochrones from start to 120 minutes.
  3. Calculate Isochrones from start to 90 minutes.
  4. Use Microsoft.Maps.SpatialMath.difference operation to resolve the area between 90-120 minutes.
  5. Buffer the area, Microsoft.Maps.SpatialMath.buffer
  6. Use the buffered area and Microsoft.Maps.SpatialMath.intersection operation to calculate the route that is between 90-120 minutes (intersection)
  7. Visualize the calculated (intersected) area.

In these steps, a pretty complex problem has been addressed. From the routing-service I got the isochrones, then it is easy to combine the isochrones with geometry math operations. The operations I used is:
  • Intersection (to see where the buffer overlaps the difference area.
  • Buffer (for better visualization of the located area)
  • Difference (between the isochrones)


Now it is easy to find a spot where the driver must find a place to stop. Remember, from the beginning this is not a trivial problem, by combining powerful geodataservices, client-side operations and knowing how to solve the pieces in the puzzle makes it is easy to finish.

I made a demo application to this post. https://github.com/perfahlen/BingMaps-Routing-And-Module-Pearls

måndag 17 juli 2017

Extended geospatial routing service in Bing Maps?

Sometimes GIS are complicated. Especially when it comes to access to data. I remember when I was building a dynamic routing engine based on PostGIS and data from Navteq. The dynamic part consisted of different vehicles behaving different in traffic. For example a truck or bus doesn't behave in the same way as a motorcycle or car. And moreover there can be obstacles, for example height and weight on bridges or the curve is too narrow. Most of the routing engines today are fast - not dynamic, or dynamic and less fast. 

However, after discussed with a good friend about the secret keys to routing, using most of networks SQL indexes skills, adding some routing tricks we manage to make it pretty fast and dynamic, for the time being (2011). But it was hard to make it scale. Routing is CPU heavy and there are no rights and wrongs when it comes to routing. For example, the best route can be the shortest, fastest, safest or maybe most beautiful! 

Isochrones 

During that time I also played with isochrones. An isochrone is the routing extent, for example 50 km from a given point. Not just a circle. In every case 50 km radius covering a bigger area than the corresponding isochrone. I have seen many municipalities using radius for example for the fire department. However, project Nanjing addresses that issue.

Radius and Isochrone showing approximately 60 km from
Sundsvall, Sweden
Projects as Nanjing are important making complicated use cases available for the public. Many organizations doesn't have the knowledge, fundings etc to pull this off. Using real distances, or time to calculate coverage or use it for further processing. I hope many other data providers with API:s will consider taking a GeoJSON as an argument. In that way, it will be possible to from a GeoJSON as one criteria among others. Project Wollongong from Microsoft probably makes that behind the scenes. 

After trying the Nanjing API for the first time I was a bit surprised. I expected a GeoJSON as response, but it was a JSON with geographical information. It is not a big thing and it is easy to serialize - but I was surprised. My experience is to use standards whenever it possible. And in this case sending geographical information as JSON I use GeoJSON. The projects API is pretty straight forward to use and there are examples in a handful of languages.

However project Nanjing as a really new cool useful geospatial feature available for preview as today. I hope it will be part of the Bing Maps platform since it address an important useful feature.

There are several others project available for preview and a presentation on channel9.

tisdag 4 juli 2017

POGO RENT 3000 PART 2


In the first part, I described how to build for a robust GIS system. In this part I’ll move on to static maps and modules.

The Pogo Rent Website have a need to show a few non-interactive map images where it is great to Pogo. Moreover, the company also wants to send confirmation e-mails to customers who have booked a pogo. In the e-mail maps should be included showing great place to pogo in the area where they have rented the pogo.

Static Maps

Static maps are great. In many cases you just need to provide an image. You really don’t need an interactive map. Sometimes you just want to show a location, or a route between locations. For this purpose, static maps are great. So where does static maps fit in our solution? On our web site! We want to show spots where it is great to pogo. It is really easy to embed a static map. Just treat it as any image! For example
<img src="http://dev.virtualearth.net/REST/v1/Imagery/Map/Road/-28.014407569005286,153.42029571533203/12?mapSize=200,200&key={BING KEY} />


The above will include an image on a web page that is 200x200px in size. Since it is an image it can be treated as an image. For example, put them in a slider. It is a bit tricky to get the URL correct, here is the documentation on MSDN https://msdn.microsoft.com/en-us/library/ff701724.aspx. And a 3rd party configuration tool is available online here http://staticmapmaker.com/bing/.
In the example site, I have just included static maps as images since it fits our purpose of showing where to pogo.

Modules

Modules is a pluggable technique to add functions to Bing Maps. In the demo site the GeoJSON module being used. There are a several modules, for a complete list see here, https://msdn.microsoft.com/en-us/library/dd877180.aspx. There is also an open source project for modules on Codeplex. The project is originally for Bing Maps v7 control, the good news is most of them works with v8 control. There is a compability list here https://bingmapsv7modules.codeplex.com/wikipage?title=Module%20Compatibility%20with%20Bing%20Maps%20V8.

Open source Modules


The v7 contral has an open source project for modules. I think the modules for v8 control should be released as Open Source, with a MIT-license. Modules extends the control and therefor it provides a great opportunity for developers to modify, enhance, extend modules to fill their needs. V7 control has a great project, I know many modules works for v8 control. Combining v7 modules and v8 modules would be a powerful combination. I think the modules have a place on GitHub like many other Bing Maps project from Microsoft. More over, I think Microsoft is the natural coordinator and organizer of such open source project. There is a risk that there will be modules spread in different repositories and no compilation of the modules.  The compiled list on Codeplex is really an asset. It also gives a hint of no of contributors that work in one place. So with this paragraph I really encourage to coordinate such project to keep the modules together.

The code is here on GITHUB and a live example temporary hosted here..

onsdag 21 juni 2017

Pogo Rent 3000

Background

The aim of the article is to give and idea how to build robust GIS applications build on .Net and Bing Maps.
Pogo Rent 3000 is a fictional company that hires pogo sticks round the world. As a consultant, I am asked to help implement GIS functionality to their web site and to where ever it gives value. Through a couple of posts I will show how to address this in a pragmatic way. For start the company wants to show a basic map with great Pogo parks in northern Sweden.
The aim of this article is to describe the implementation of Pogo Rent 3000. The idea of this project is to provide a solid implementation of a GIS project based on Bing Maps. The techniques and framework used are well known and provide a robust foundation for GIS applications.
I strongly recommend using standard formats for communication with GIS backend is really importance and cannot be stated enough. The application also showing an example of an endpoint that simulates a Web Feature Service (WFS from OGC, see http://www.opengeospatial.org/standards/wfs) or included in the code as a GeoServiceController. OGC formats and protocol gives flexibility and maintainability.

Application structure

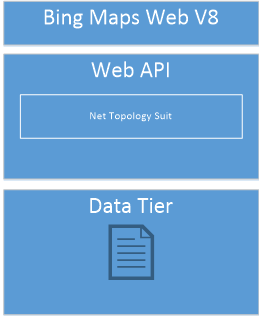
The application is structured the simplest way possible and providing a robust platform to extend the system later on. I build a classic 3-tier application.

UI Tier

On top there is Bing Maps V8, it is one of the best map client out there as today. It provides a straight forward, documented API. More over a set of spatial function like measuring and a set of modules. A module is functionality you can extend the web client with. For example, with GeoJSON, (http://geojson.org) support. The small script that is needed is, for convenience, written in TypeScript. GeoJSON is an OGC standard since 2016. This means we can add in other datasets from other sources without worrying about the format as long as it is GeoJSON.
With the GeoJSON module it is super easy to parse the JSON from the server.
let primitives = Microsoft.Maps.GeoJson.read(geoJSONtext) as Array;

Service Tier

As service tier I have a Asp.NET Web API. This tier is boosted with Net Topology Suit (NTS, https://github.com/NetTopologySuite/NetTopologySuite) which provide a rich set of GIS operations. NTS is great for adding spatial functions to the application. It also provides GeoJSON support. With this in place we have the possibility to serve OGC formats.

Data Tier

In this example we use a single text file as data source. The source is a GeoJSON file. I could of course easily just accessed GeoJSON file directly through a GET request from the client but for demo purpose I actually read and parse the file with NTS. The data tier also have an interface. The idea with the interface is that it should be easy to add other data sources, for example SQL Server.
Reading GeoJSON with NTS is really simple, here is a snippet from the application:
var reader = new NetTopologySuite.IO.GeoJsonReader();
var features = reader.Read<FeatureCollection>(data);
     
Data is the GeoJSON. It will parse the json into an object which we can spatial filter, manipulate compare or do other operations.

Wrap up

With the techniques and framework in place, it is pretty straight forward to implement. The implementation is as simple as possible and it provides possibility to extend the PogoRent3000 system. To summarize, building a GIS application is not different than building any 3-tier application.

A demo application is online here.

And the code is here 

A special thanks to SoulSolutions.


onsdag 7 juni 2017

Maps for blinds - with Bing Maps

In the late 90's I worked with Swedish Institute for Disability, we were doing R&D about Maps for people who are either blind or a big disability seeing. Last week at an event the last session was about how IT made life more accessible for people who are blind. I was not surprised I met a blind programmer. Back in the 90's we were doing C++, nowadays it is C#. 

After that session I started to think that maybe many of our challenges at that time would be more easy to overcome now or even not a problem. A major challenge at that time was just access to GIS data. Today it is not a problem. At that time text to speech was also a problem and really a new thing, at least on the consumer market. Today, there are several on Windows Store for free.

I have made some Googling, and Binging and I found some ambitious initiatives regarding the subject. But some were even not working and were build on outdated libraries. So I decided to do something by combining the thoughts we had from that late 90's and common widespread technology. And guess what. Things that took weeks or months took me just a couple of hours. Most of the time thinking, maybe this is not relevant. But I decided to publish this anyway.

describing the application
Every person has a mental map we use to navigate. We know, or at least have an idea how locations are related. One idea about the application is to help the user to build up an mental map about how things are related. That is one reason the application is really simple and narrowed down. It consists of three text fields:

1. Bing maps key field
2. Search field 
3. Result field. 

The search field as made for searching. The result field is made for display search result WHEN the user clicked on the map. When the user clicks on the map there is a reverse geo-coding made in the background. The result is displayed in the text field so it should be possible to use the speech to text.

When the user moves the mouse it will give a sound signaling the user how close to center of the map she is. The brighter sound the closer to the center. Combing sound, reverse geo-coding and searching I hope this might useful.

I also started to think that vendors should also provide semantic about the imaginary the deliver. It would be interesting to request metadata over a view as when requesting itinerary. 

Here is the code. You need to provide your own Bing Maps key. You can get one from the portal.


tisdag 21 mars 2017

Browser: HTTP Error 502.5 - Process Failure

Just upgraded to Visual Studio 2017 from Visual Studio 2015. Everything went well until I deployed the application. I kept getting 502.5 from the server.

I turns out Visual Studio 2017 changed   from 1.1.0 to 1.1.1. I found it by opening the project.csproj file.Just right click on the project open the file and make sure 
Lägg till bildtext
the hosting environment has that version installed. In my case I just needed to change back to 1.1.0 and bang it started to work.

Here is where I got the hint what to search for.


måndag 20 mars 2017

Bing Maps and GeoBuf

Background
Geographic data can be large, or huge in size. Lots of application demands offline data or for scenarios where you have limited storage, like mobile devices. GeoJSON is the industry standard for communication from server to web client. It has many advantages, for example it is standardized and readable for humans. A disadvantage is that it can have loads of redundancy, for example it can share the same border which increases the data set. For that there is another format, TopoJSON which can save 80% or even more.

Both formats are text based and the commonality is JSON. When it comes to large datasets: if it is possible using TopoJSON is a good idea depending on how the data sets looks like. It is also possible to down size the data by cutting some decimals. But sometimes it is not enough. Sometimes we need something else. Something that makes a different. GeoBuf is such a format that is not so public known but the format is on uprising the last years.

GeoBuf

GeoBuf is an extension of Protocol Buffers. GeoBuf using GeoJSON when encoding the data. In the example provided it packed the data almost x 10. Since GeoBuf using GeoJSON it is straight forward to apply. I would be surprised if it doesn’t show up in spatial servers soon, there is an initiative for PostGIS. However, the product is from one vendor, not standardized so there is no guarantee that it will not be changed without notice or backword compability. Not likely though, but possible working with propriety formats. GeoBuf comes with ISC license. The downside of geobuf is it takes some time to first unpack the data and then parse the GeoJSON.


Example implementation

The example provided packs the countries in the world, a GeoJSON file with the size of 23.5 MB. The server logic, written in NodeJS, is super easy and straight forward.


var countries = fs.readFileSync("./public/countries.json")
var geoJson = JSON.parse(countries)
var content = geobuf.encode(geoJsonnew pbf())
var buffer = Buffer.from(content)
return buffer

That’s it! We are done on the server. The example using Express for structure and routing in the application.

On the client. It is even easier with the GeoJSON module!

var geojson = geobuf.decode(new Pbf(geoBuffer));
var geoms = Microsoft.Maps.GeoJson.read(geojson);
client.map.entities.push(geoms);

So, with 7 lines of code GeoBuf helped downsize the data size with a factor of almost x10!


And network data.


Happy buffering!

onsdag 21 december 2016

Building a streamed Geofence with Bing Maps and XSockets.Geo

Preample

A questiontion that rises from time to time is real time application with Maps. In an earlier blog post I showed how to build a streamed layer. Products such as XSockets provides great communication and integration opportunities. To boost the product I have added a geo-functionality to XSockets.

In this application I have implemented a geofence example. The application works the following
  1. The user define a fence by drawing
  2. The user can test points if they are inside the fence or not
  3. The map plots the point and coloring it depending on the point is inside or outside the fence. Red outside, green inside.

Back End

The back end based on XSockets and topped with NetTopolgy Suite (NTS). With NTS it is possible to perform advanced operations and analysis. This example using within operation on a geometry object. The backend recieves a stringified GeoJSON message from the server serialize it to a NTS geometry. The back end is just about 50 lines of code,  it also shows that state is a really awesome feature in XSockets!


Front End

The front end is based on Bing Maps v8 web control. This control is one of the most advanced on the market. By adding the module GeoJSON it is possible to communicate with the backend in a standard way and we talk the same language. So GeoJSON is in one way the glue between the client and the server.

Bing Maps Modules

Bing Maps has a module systems that enable functionality to be added to the control. In this demo application two modules where used.
  • The GeoJSON module
  • Drawing Tools module, I hope this module will be more customizeable in the future. I might have missed something... In this application hiding and showing tools is hack style.

Implementation

The client code is written i Typescript. Bing Maps provides Typescript defintions for their library. With those libraries (there are also libraries for the modules). TypeScript definitions doesn't have to be comprehensive. For XSockets I wrote 23 lines of code for the definitions I needed.

The sample application is deployed on Azure. The web as a web application and the server as a worker role.

To sum up, with those Component: Bing Maps, XSockets topped with NetTopology Suite provides a robust geofence example application.

The code is available on GitHub. The application lives here.